Heatmaps can be captured on web and mobile web.
Creating Heatmaps
Prerequisite
Before launching a Heatmap study, a Sprig Admin must customize the Heatmap privacy settings.
Set Privacy Settings
To set Heatmap privacy settings:
- Navigate to Settings > Replays > Configure.
- Note: Masking settings apply to Replays and Heatmaps.
- For web studies:
- Select the Web tab.
- Under Web Replay Privacy, choose the appropriate masking setting: Basic, Moderate, or Strict.
- See Masking Settings for more information about the various masking settings for web.
- Customize Heatmap privacy by masking additional elements:
- Under Advanced Privacy, add elements by CSS selectors to mask their content.
- Note: Be sure to check your quotation mark formatting. Straight quotes ("") are supported for class masking, but typographic quotes (“”) may cause masking issues.
- For iOS studies:
- Select the iOS tab.
- Under iOS Replay Privacy, choose the appropriate masking setting: Basic, Moderate, or Strict.
- See Masking Settings for more information about the various masking settings for iOS.
- Customize Heatmap privacy by masking or unmasking specific elements:
- Under Advanced Privacy, add elements by class name and choose whether to mask or unmask their content.
- Note: Be sure to check your quotation mark formatting. Straight quotes ("") are supported for class masking, but typographic quotes (“”) may cause masking issues.
For Android, all secure form content, including password fields, are not recorded or stored by default. Input fields configured with the TYPE_NUMBER_VARIATION_PASSWORD attribute are automatically masked, ensuring that sensitive numeric input is obscured to enhance privacy and security.
Create a Heatmap
- Click + New Study and select Heatmap
- Name the Heatmap and add it to a specific study folder if desired.
Targeting
- Under Targeting > “Triggers when…”, add an Event or a URL trigger.
- The event will determine when users trigger the Heatmap.
- (Optional) Add additional filters to the “If user…” section.
- This can be done with user attributes, groups, or event history to ensure you are capturing the right users at the right time in their product experience.
Attaching a Replay (Optional)
- Add a Replay to collect Replay clips alongside page interaction data.
- Adding a Replay to a Heatmap will allow you to capture aggregate view data from the Heatmap with individual user sessions from Replays.
Replay clips associated with Heatmaps are not visible in development environments.
- Capture Settings: Choose to capture data continuously, until a certain number of page visits, or until a specific date.
- Capture Options: Determine whether to capture data for users once, or unlimited times.
Launch
- Click Launch Heatmap to start collecting data.
Add Study Goal (Optional)
- Adding a study goal for a Heatmap improves the Sprig AI summary results by focusing your specific product question.
Heatmap Visualizations
After capturing data for at least one user, a Heatmap will display data visualizations. The visualizations will be constructed from the 5000 most recent captures that match any filtering criteria.
The visualizations are categorizes into three forms:
- Heatmaps aggregating clicks into color-coded engagement zones
- Clickmaps showing individual clicks
- Scrollmaps displaying max scroll depth for user sessions
Hover over or click on elements in one of the visualizations to see the total number of clicks on that element and relevant Replay clips, if enabled. For example, if you want to know why users click the Help button, clicking on that area within the Heatmap and observing the attached Replays will help you uncover why users are seeking help.
Visualization Overview
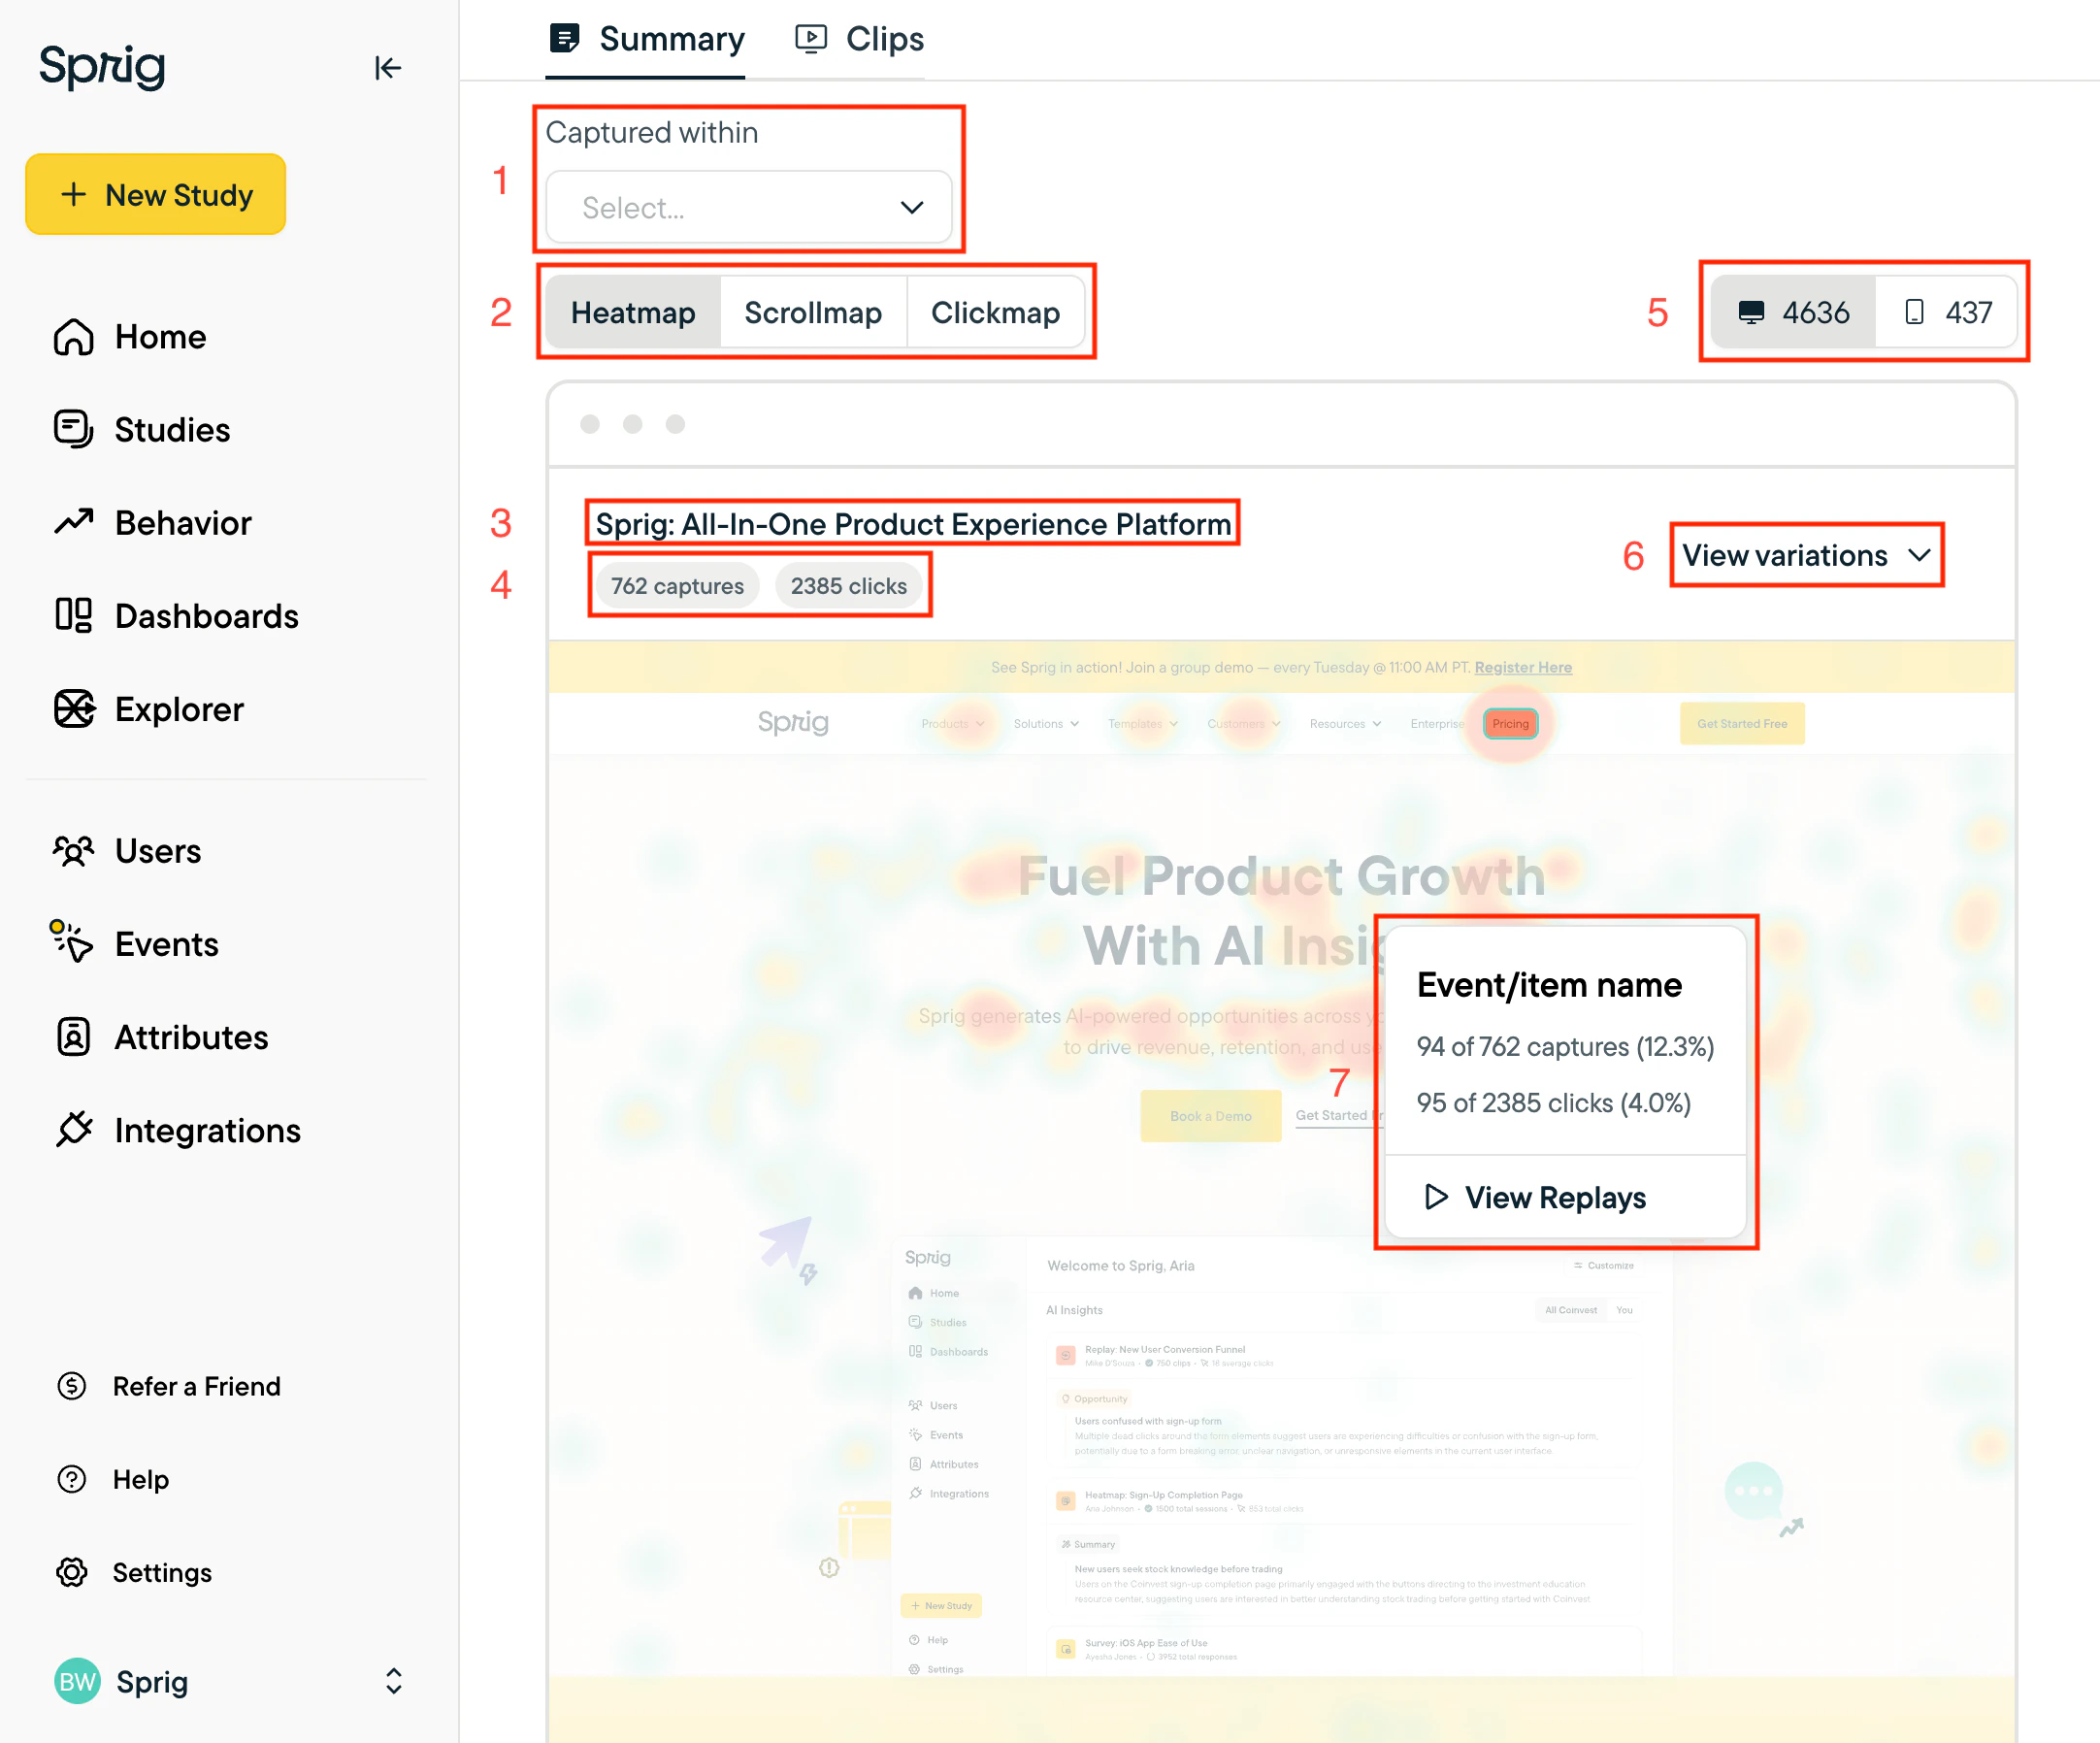
- Time filter
- Visualization controls: Heatmap, Scrollmap & Clickmap
- (Report metadata) Page name that matches the backdrop image in the report
- (Report metadata) Captures & clicks contained in the report based on applied filter criteria
- Device toggles: Switch between Desktop & Mobile Web
- Change backdrop image
- The view variations modal will render a few different representations of webpages that are captured in the Heatmap report suggested by Sprig’s algorithm.
- Note: Changing a backdrop will save the backdrop for all Sprig team members
- Heat Card: See additional data and Replay clips (if applicable) of users that interacted with a particular element on the page
- Percentage of clicks & captures are calculated as a percent of the data represented in the report
FAQs
Why do I see a different number of clicks and captures from one background to another?
Heatmaps are built based on interactions with HTML elements that are represented in the selected background.
For example, if the same button spans across two different backgrounds, then the same number of clicks for that particular button will display on both versions of the Heatmap. Conversely, if a particular button appears on one background but not the other, those clicks will not count towards the total. 
