

Heatmaps can be captured on web and mobile web.Documentation Index
Fetch the complete documentation index at: https://docs.sprig.com/llms.txt
Use this file to discover all available pages before exploring further.
Creating Heatmaps
Prerequisite
Before launching a Heatmap study, a Sprig Admin must customize the Heatmap privacy settings.Set Privacy Settings
To set Heatmap privacy settings:- Navigate to Settings > Replays > Configure.
- Note: Masking settings apply to Replays and Heatmaps.
- For web studies:
- Select the Web tab.
- Under Web Replay Privacy, choose the appropriate masking setting: Basic, Moderate, or Strict.
- See Masking Settings for more information about the various masking settings for web.
- Customize Heatmap privacy by masking additional elements:
- Under Advanced Privacy, add elements by CSS selectors to mask their content.
- Note: Be sure to check your quotation mark formatting. Straight quotes ("") are supported for class masking, but typographic quotes (“”) may cause masking issues.
- Under Advanced Privacy, add elements by CSS selectors to mask their content.
- For iOS studies:
- Select the iOS tab.
- Under iOS Replay Privacy, choose the appropriate masking setting: Basic, Moderate, or Strict.
- See Masking Settings for more information about the various masking settings for iOS.
- Customize Heatmap privacy by masking or unmasking specific elements:
- Under Advanced Privacy, add elements by class name and choose whether to mask or unmask their content.
- Note: Be sure to check your quotation mark formatting. Straight quotes ("") are supported for class masking, but typographic quotes (“”) may cause masking issues.
- Under Advanced Privacy, add elements by class name and choose whether to mask or unmask their content.
TYPE_NUMBER_VARIATION_PASSWORD attribute are automatically masked, ensuring that sensitive numeric input is obscured to enhance privacy and security.
Create a Heatmap
- Click + New Study and select Heatmap
- Name the Heatmap and add it to a specific study folder if desired.
Targeting
- Under Targeting > “Triggers when…”, add an Event or a URL trigger.
- The event will determine when users trigger the Heatmap.
- (Optional) Add additional filters to the “If user…” section.
- This can be done with user attributes, groups, or event history to ensure you are capturing the right users at the right time in their product experience.
Attaching a Replay (Optional)
- Add a Replay to collect Replay clips alongside page interaction data.
- Adding a Replay to a Heatmap will allow you to capture aggregate view data from the Heatmap with individual user sessions from Replays.
Configure Capture Settings and Options
- Capture Settings: Choose to capture data continuously, until a certain number of page visits, or until a specific date.
- Capture Options: Determine whether to capture data for users once, or unlimited times.
Launch
- Click Launch Heatmap to start collecting data.
Add Study Goal (Optional)
- Adding a study goal for a Heatmap improves the Sprig AI summary results by focusing your specific product question.
Heatmap Visualizations
After capturing data for at least one user, a Heatmap will display data visualizations. The visualizations will be constructed from the 5000 most recent captures that match any filtering criteria. The visualizations are categorizes into three forms:- Heatmaps aggregating clicks into color-coded engagement zones
- Clickmaps showing individual clicks
- Scrollmaps displaying max scroll depth for user sessions
Visualization Overview
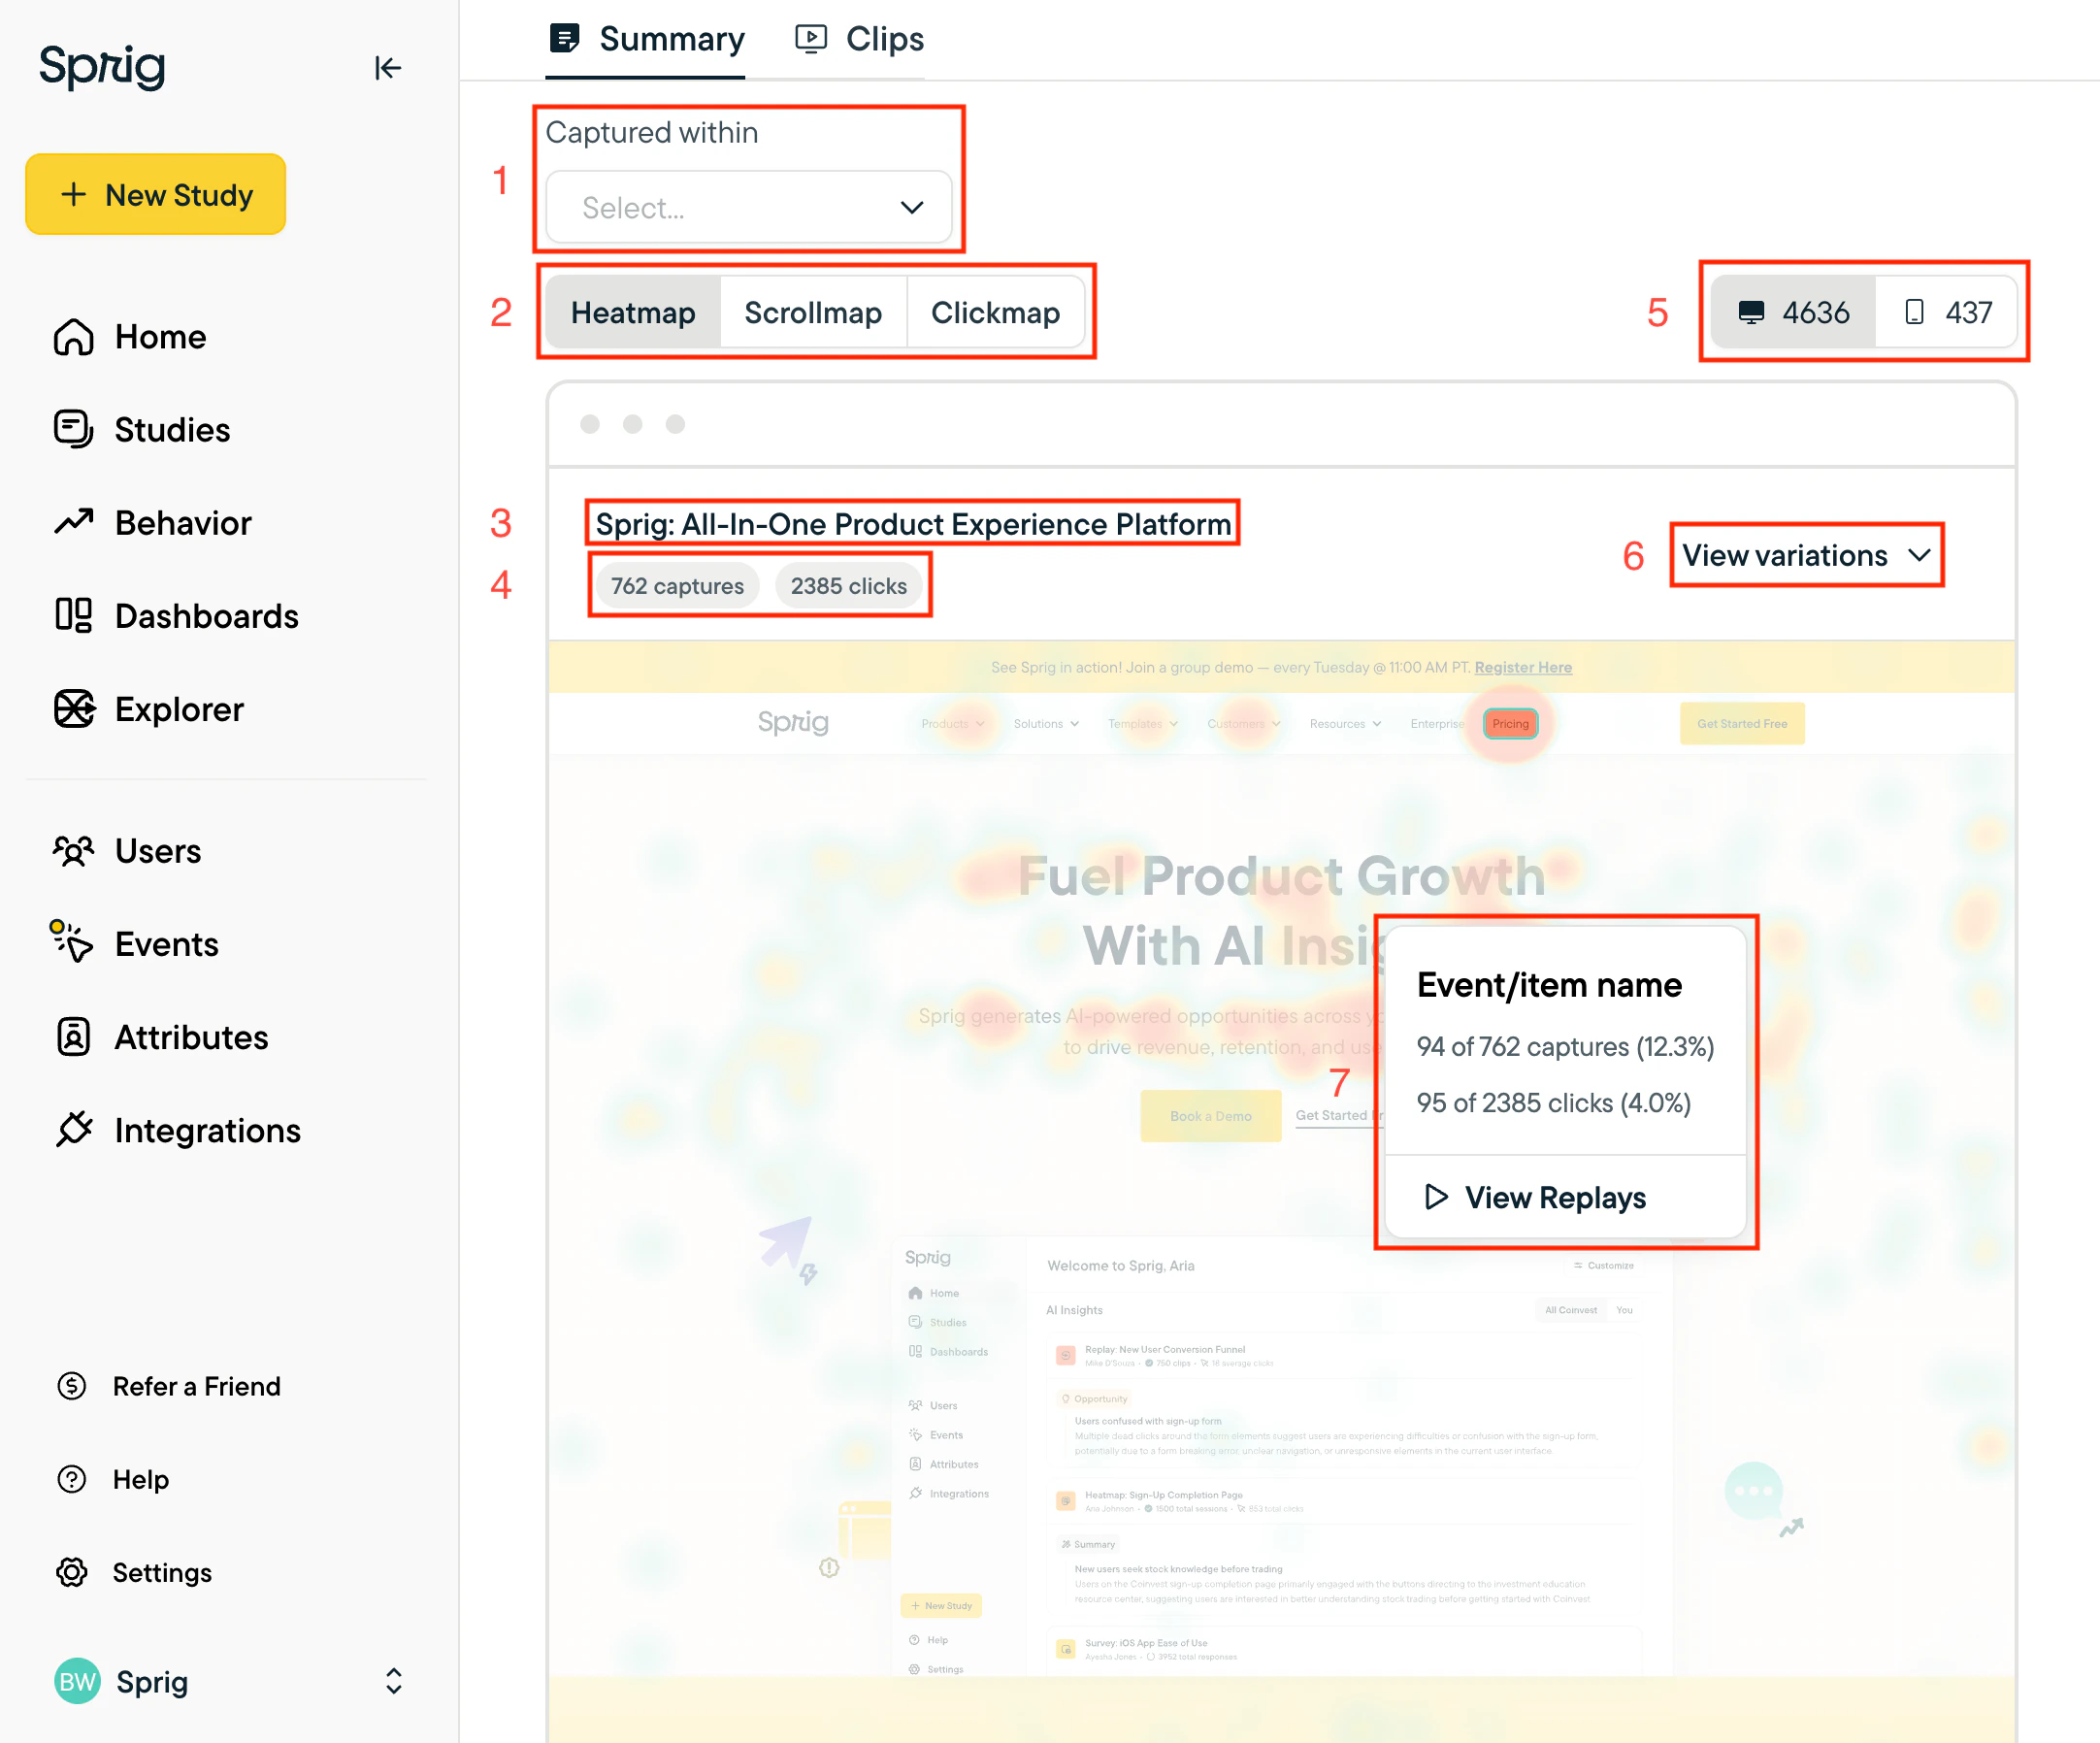
- Time filter
- Visualization controls: Heatmap, Scrollmap & Clickmap
- (Report metadata) Page name that matches the backdrop image in the report
- (Report metadata) Captures & clicks contained in the report based on applied filter criteria
- Device toggles: Switch between Desktop & Mobile Web
- Change backdrop image
- The view variations modal will render a few different representations of webpages that are captured in the Heatmap report suggested by Sprig’s algorithm.
- Note: Changing a backdrop will save the backdrop for all Sprig team members
- Heat Card: See additional data and Replay clips (if applicable) of users that interacted with a particular element on the page
- Percentage of clicks & captures are calculated as a percent of the data represented in the report