Interpreting Studies

Understanding your study's progress.

At the top of the results page for each study you launch, Sprig provides statistics to help you understand the study's status and performance throughout its run.

Study Performance Statistics
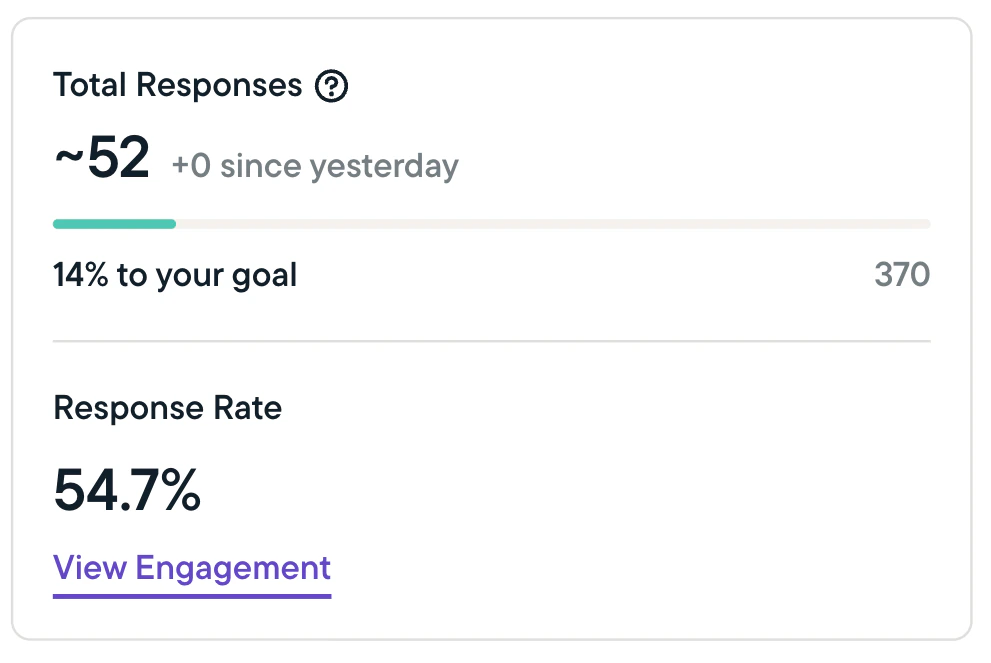
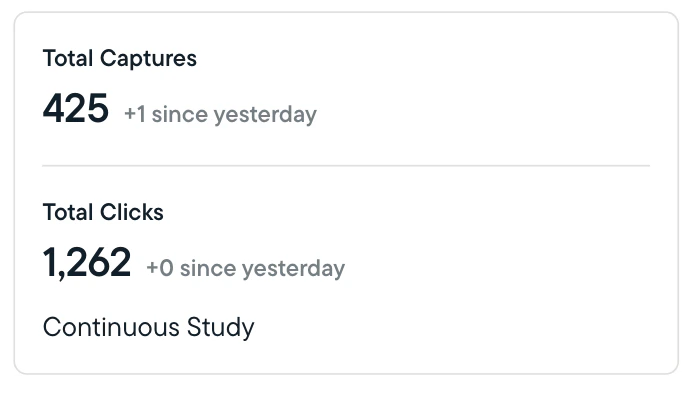
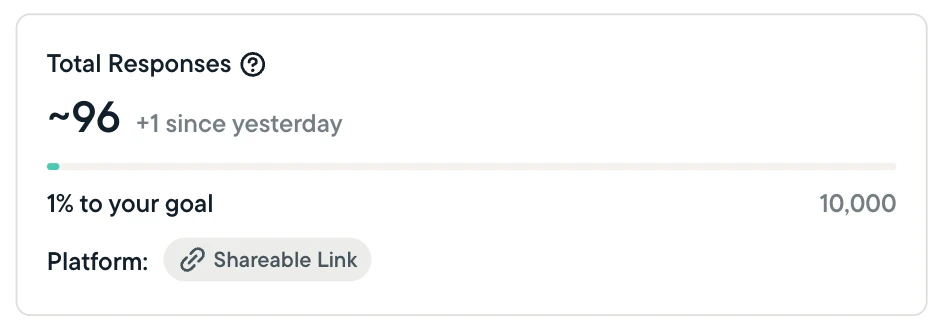
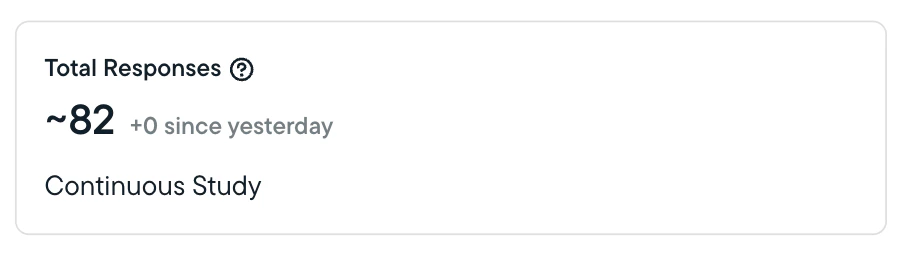
The first glyph shows the completion percentage shows how close you are to completing your study based on the target number of responses you've set. The above example shows 14% completion; the study will reach 100% and be complete once it collects 370 responses. The second icon indicates the number of responses received in the past 24 hours; in this case, 0. The third icon shows the response rate; it is calculated slightly differently depending on which platform you are using:

  • Web & mobile studies - The response rate is calculated by dividing the number of responses received by the number of studies seen by a respondent. In the above example, the number of studies seen is 52 x 100/77.6 = 67.
  • Link studies - Response rates are not displayed since Sprig does not track how many link studies are sent or seen.

Key Terms

Sent: The term 'sent' has different meanings depending on which platform you are using for your study:

  • Web and mobile studies - A web or mobile study is considered 'sent' when it is scheduled to be displayed to a user who is currently active on your site or app.

Seen: The term 'seen' has different meanings depending on which platform you are using for your study:

  • Web and mobile studies - A study is considered 'seen' when displayed in a user's browser or app. Studies that are sent may not be seen if, for example, a user navigates away from a page before meeting time-on-page criteria set during study creation.

Response/Answer: A 'response' is counted every time someone answers one or more questions in a study; as such, the total response count includes both users who complete the entire study and users who only complete a portion of it.

Completed: A question is completed with a valid response or answer.

Skipped: The respondent has navigated to another page but the question is not completed with a valid answer.

Sprig AI Analysis

One of the richest sources of customer experience data is an open-text survey response. Historically this is also one of the most difficult data formats from which to extract meaningful insights, especially at scale.

When product teams run surveys with open-text questions, a common goal is to group the huge number of responses into a small number of bite-size and actionable takeaways. The identified themes are shared with product stakeholders and play a critical role in determining how to improve the product experience. An example with some responses and a summarizing theme could be:

  • Response: "I'm lost, can't really find anything easily in the product."
  • Response: "It'd be nice if there was a way to find users by name."
  • Response: "Please add a search field."

Solution create a theme: “Add search functionality”

Performed manually, this analysis takes the form of placing the responses into a large spreadsheet, reading through them to locate patterns, defining themes that represent actionable groups of responses, and then assigning all responses to one or more of these themes (a.k.a. "coding"). This is a detailed process and can't scale easily beyond a few hundred responses. Automating this process is a powerful way to increase the leverage of a product team and reduce the survey life cycle from weeks to hours. The ability to do this accurately and at scale is one of the key differentiators between Sprig and other product experience insights platforms.

Sprig AI Analysis

Sprig AI Analysis saves you from endless manual analysis by automatically transforming open-text survey responses into actionable product insights with the power of OpenAI's GPT large language model. AI Analysis synthesizes open-text survey feedback into product opportunities and issues with additional summary details, so you have a clear-cut picture of your users' feedback without having to review individual responses.

Sprig sends responses to OpenAI’s GPT model to generate summary themes, which include a short label with description capturing the nuance of the responses. Note that OpenAI API data is automatically deleted after 30 days and NOT used to train the Open AI models. With new responses, themes are assigned in real time and regenerate to account for shifts in response clusters. Themes are also monitored by humans for quality assurance.

To find the AI themes generated by the responses to your open-text questions:

  1. In the Navigation pane, click Studies. Click on the study in question.
  2. Click Summary, then scroll down to the open-text question response table.
  3. All themes identified by Sprig will be shown in the table. Make sure to click list on any themes of interest to review the individual open-text responses driving it.