Survey Diagnostics Funnel
Understand the estimated population of end users at particular steps in Sprig’s survey selection and contact engine
Survey Diagnostics Funnel Overview
The Survey Diagnostics Funnel allows you to understand the estimated population of end users at particular steps in Sprig’s survey selection and contact engine. The funnel will enable study owners to self diagnose why they may not be getting as many responses as expected and troubleshoot survey design.
Sprig uses an event-driven model. Each time a user sends an event to our backend, we check to see if there is a potential survey or set of surveys to present to the user. This process is documented in a surveys engagement funnel located in the Responses widget. Here’s an example of what a survey engagement funnel may look like:
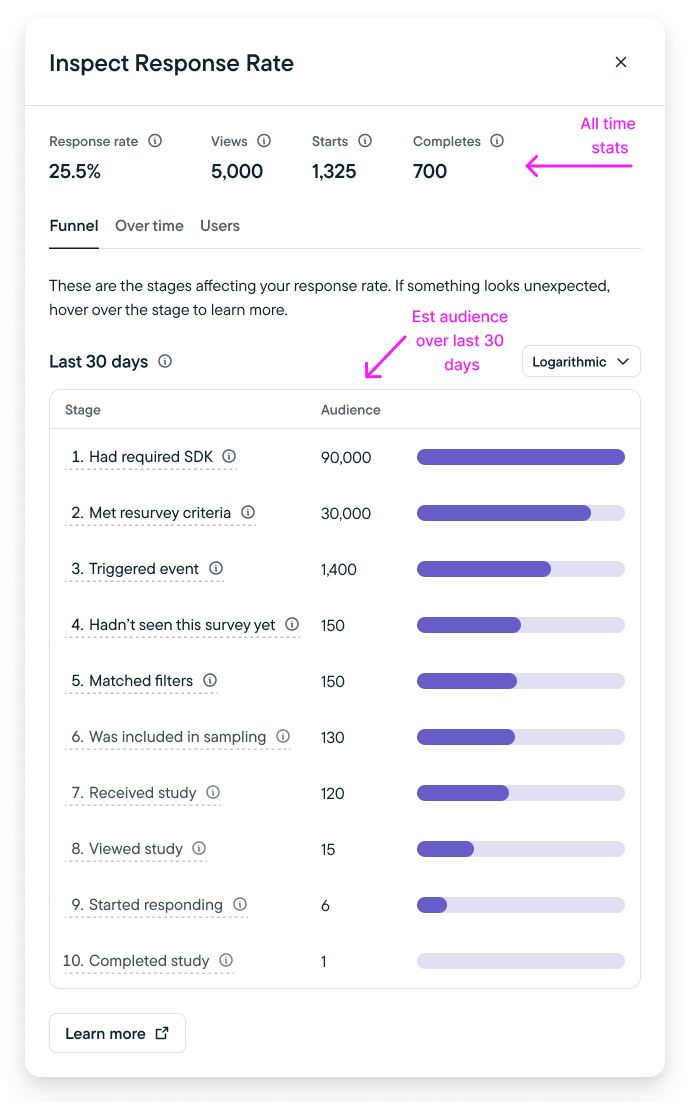
Inspect Response Rate Modal
It’s important to note that not all of these steps will be present in each funnel.
In particular, the following steps may not always be shown, as these will be dependent on the configuration of the study in question as well as other studies on the account:
- Matched Filters
- Included in Sampling
- Selected for this Study
Survey selection works in the following steps:
- A single event from a single visitor is received by the Sprig backend
- We select the entire universe of in-progress surveys for that environment
- The survey selector code begins to filter this universe down by filtering out surveys that:
- Have the wrong SDK version
Step: “Had required SDK” - Do not match resurvey criteria
Step: “Met resurvey criteria” - Have a different event trigger than the one the user triggered
Step: “Triggered event” - That the user has already seen (based on resurvey criteria)
Step: “Hadn’t seen this study yet” - That the user doesn’t match filters and attributes for
Step: “Matched Filters” - Need to be sampled or throttled
Step: “Included in sampling”
Step: “Selected for this study”
- Have the wrong SDK version
- The result may be:
- A single survey that is then served to the user
- A randomized array of surveys, from which the first will be served to the user
The last four steps in the engagement funnel are:
- Received Study
- Viewed Study
- Started Responding
- Completed Study
These steps happen after the universe of surveys has been filtered down to the one particular survey this user should see, and that survey has been sent to their SDK instance.
Using the Diagnostics Funnel
- For any active or completed Web or Mobile Survey, navigate to the Survey Results page.
- Select Inspect to launch the Inspect Response Rate modal.
- The debugger will show you a list of checkpoints and the estimated population of end users at each checkpoint.
Note on Limitations:
- Survey Diagnostics Funnel will be unavailable for surveys completed before October 2023.
- Audience population estimations are limited to the last 30 days of an active survey.
- If any edit is made to an active study, including copy updates or targeting criteria, the diagnostics funnel will reset and begin collecting data from time last updated.
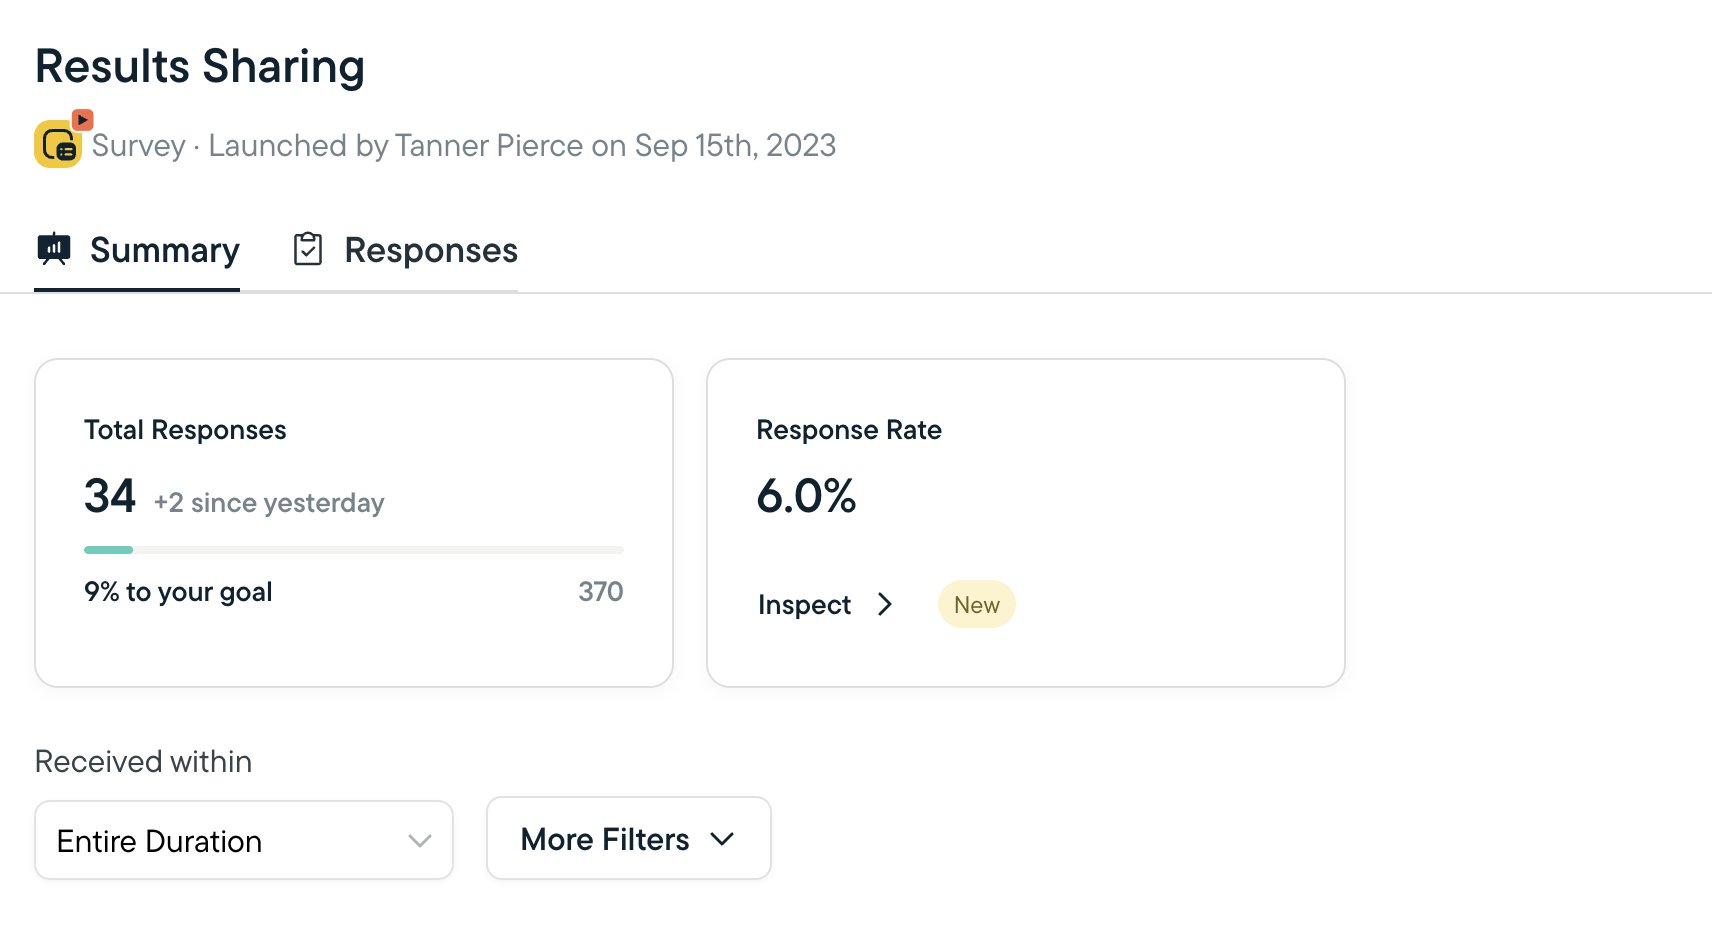
Launch from the Response Rate tile
Checkpoint Steps
Checkpoint steps and corrective measures are detailed below:
Checkpoint | Step Details | Possible Corrective Measure |
|---|---|---|
Has required SDK* | Users that are sent to Sprig and have the correct SDK installed | Update SDK version |
Met resurvey criteria | Users that are qualified based on global or survey level recontact period settings | Override global contact period, or adjust survey level recontact period |
Triggered event | Users that triggered the survey contact event | Add additional events to trigger this survey |
Hadn't seen this study yet | Users that have not seen this survey before | Adjust “Show once per user” setting |
Matched filters | Users that meet Audience, Event, or Group targeting filter criteria | Adjust filter settings to be more inclusive, or verify that filters are configured correctly |
Included in send limit | Study send limit (#of times per day or sampling) settings are captured under Audience > Response settings (Shown only when this count is different than the previous stage) | Adjust sampling or send limit criteria to be more expansive |
Selected for this study | Step is relevant only when multiple studies have the same targeting criteria | Modify this study, or a conflicting study to have different triggering events |
Received study | Users that have received the study | N/A |
Viewed study | Users that have viewed the study | Modify the "waiting period" delay to be shorter |
Started responding | Users that have started responding | N/A |
Completed study | Users that have completed the entire survey | Update study design (shorter, question types, etc) to increase completion rates |
*For mobile studies, if SDK update is bundled with an app update, end users will need to update your native app in order to qualify for a study with a minimum SDK requirement.
FAQs
How is overall response rate calculated?
The response rate graph is calculated by dividing the number of responded surveys by the number of seen surveys within a day based in Universal Time Coordinated (UTC).
How do event properties get applied?
When targeting select users based on event properties, these event properties are applied during step 5, "Matched filters". The "Triggered Event" step will evaluate the event, and then "Matched filters" will evaluate the event property filters applied.
Updated 2 months ago