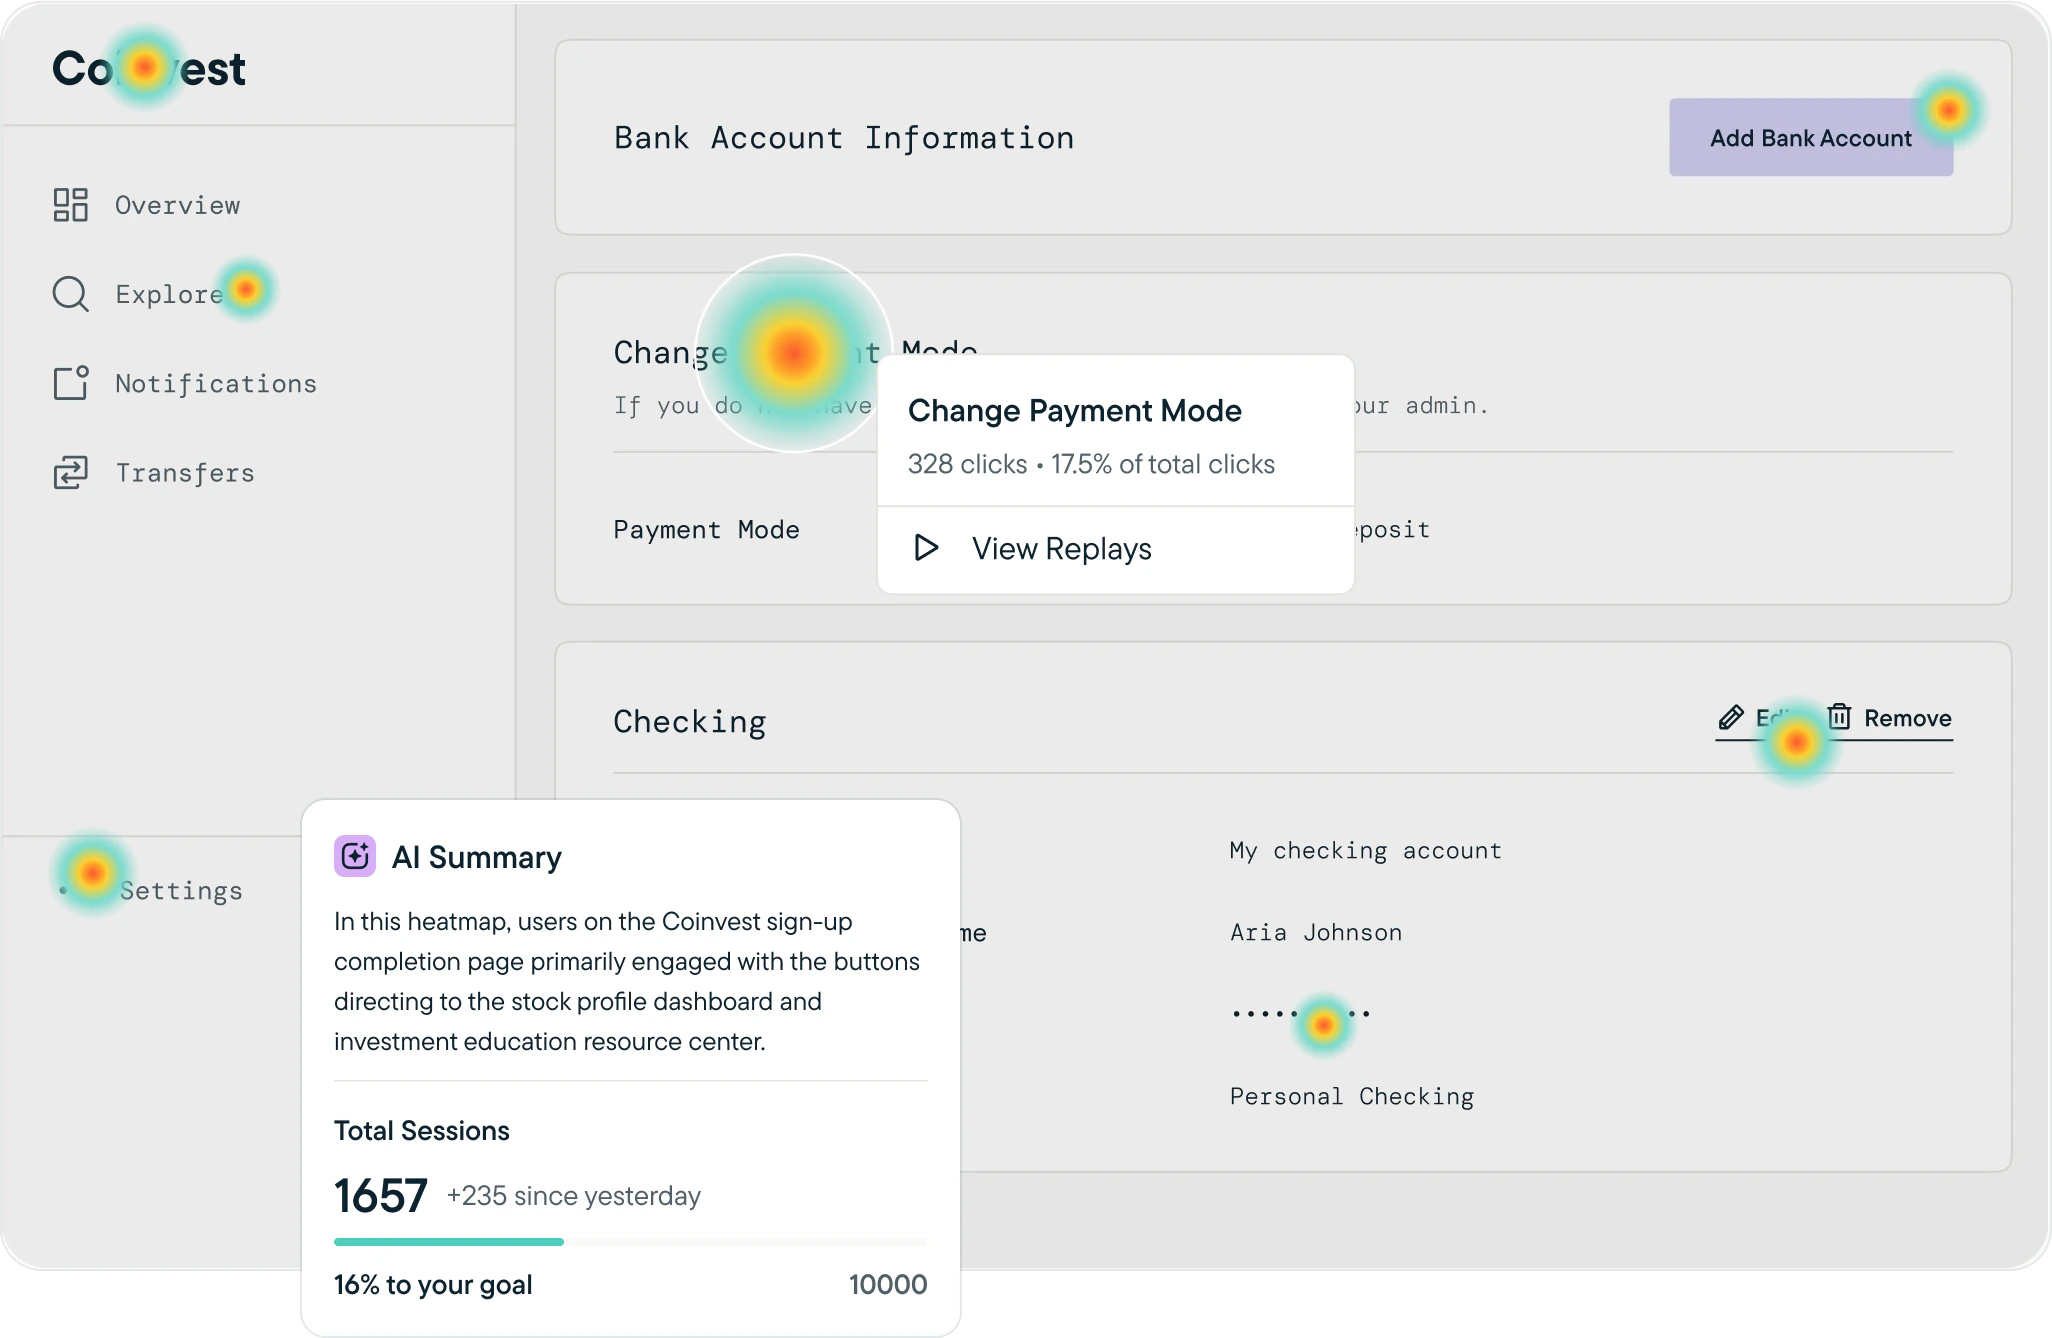
What are Sprig Heatmaps?
Sprig Heatmaps enable you to see an aggregated visual representation of user behavior within your product such as on landing pages and in-product dashboards. When coupled with Replays, you can really see the whole picture and can playback clips of users that interacted with particular elements on a page. Once the Heatmap collects data from at least one capture, it will fill in with visualization, and you’ll be able to toggle between three visualizations:- Heatmaps aggregate clicks into color-coded engagement zones.
- Clickmaps show individual clicks.
- Scrollmaps show max scroll depth for a user session
Launching Heatmaps will first require installing Sprig SDK into your website.
Installation
We have a variety of install methods for Web products, so you can easily track behavior and send surveys to users as they experience your website or web app.How can I get started?
Review how to create Heatmaps, review results, and more here. Watch a demo video here!